Prerequisites
-
Access to open a Walks With Chips (WWC) alert and select the Analytics tab, then the Daily Walk view.
What the bars mean
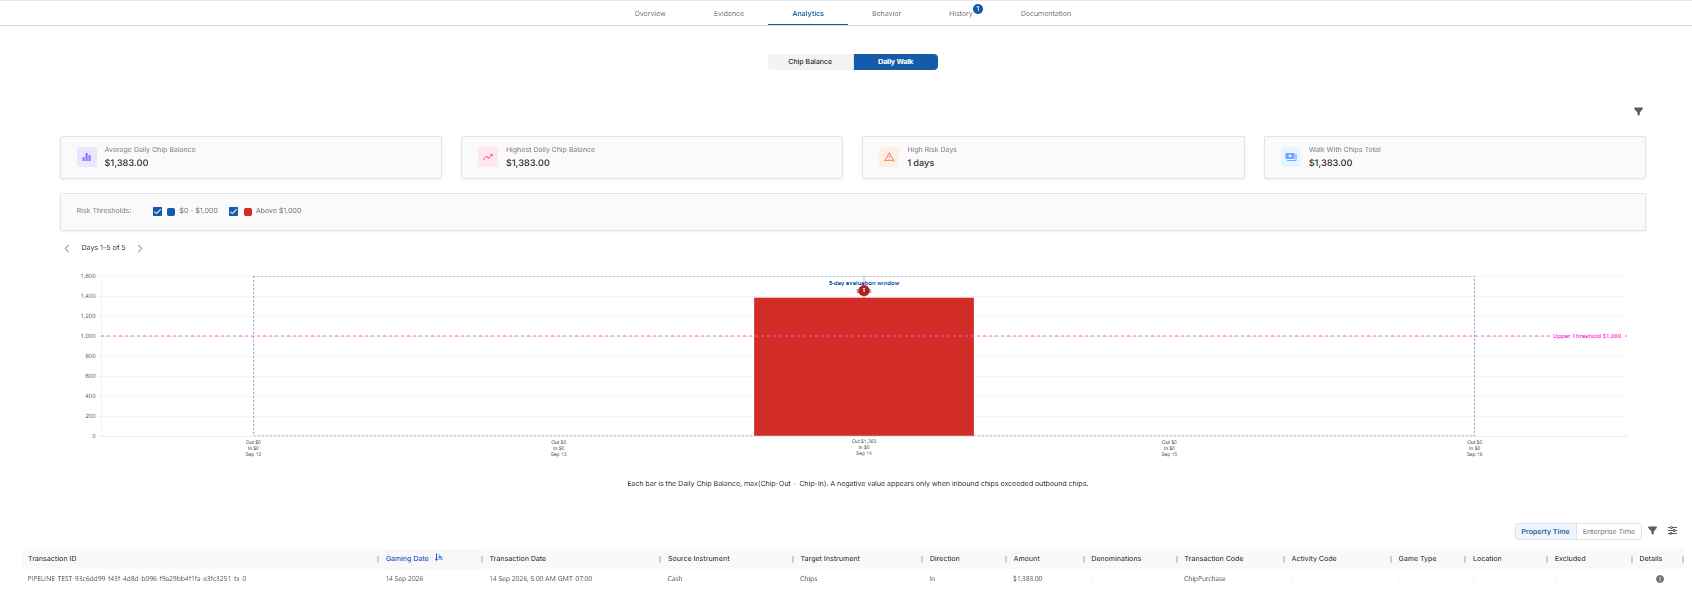
Each bar is one gaming day, and its height is the player's net walk for that day. A tall bar means the player took significantly more in chips than they cashed back that day. Each day is labelled with its Out and In amounts, and a negative value appears only when inbound chips exceeded outbound chips. The days run left to right across the alert's assessment period, and a caption under the chart explains the calculation: "Each bar is the Daily Chip Balance, max(Chip-Out − Chip-In)."
What the bar colors mean
Bars are color-coded into three risk bands, so higher-value days stand out at a glance. The band boundaries are the thresholds configured for the alert — a lower (daily) threshold and an upper threshold — not fixed amounts. In the example above, only an upper threshold of $1,000 is set, so the chart shows two bands ($0 – $1,000 and Above $1,000). With both thresholds set, the bands are:
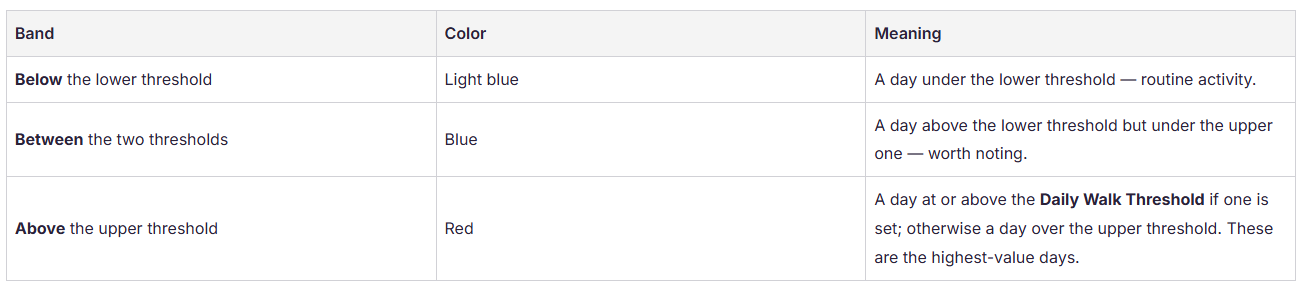
If only the upper threshold is set, the chart shows two bands instead of three. The Risk Thresholds legend above the chart has a checkbox for each band. Turning one off hides those bars, so you can focus on, say, only the days above the upper threshold.
The Upper Threshold reference line
A dashed Upper Threshold line is drawn across the chart at the threshold amount (for example, Upper Threshold $1,000), so any bar rising above it is immediately obvious. This line reflects the Alert Analytic Threshold you set for the alert — set a dollar value for it to appear. Days that cross this line are the ones counted as high-risk in the summary above.
The summary cards
Four cards above the chart summarize the days shown:

-
Average Daily Chip Balance — the average chip balance across the days with activity.
-
Highest Daily Chip Balance — the largest chip balance on a single day.
-
High Risk Days — the number of days whose chip balance reached the high-risk level shown on the chart: the Daily Walk Threshold if one is set, otherwise the upper threshold.
-
Walk With Chips Total — the total amount of chips the player walked with during the alert window.
Setting the Alert Analytic Threshold
The Alert Analytic Threshold is an optional upper benchmark for the Daily Walk view, configured on the WWC alert type's Risk assessment tab in Settings → Property → Alerts (Beta). Under Alert analytic threshold, enter a dollar value in Daily Walk Threshold, and that value appears as the Upper Threshold reference line on the chart. It's optional — leave it blank and no reference line is drawn.
Working with the chart
-
Use the arrows above the chart (for example Days 1–5 of 5) to page through the days.
-
Click a bar to filter the transaction list below the chart to that day, so you can see the individual transactions behind the day's total.
-
Use the filter icon to switch the chart between Gaming Date and Transaction Date.
-
If pattern qualification is configured, the chart outlines the evaluation window and numbers each qualifying event.
-
The Property Time / Enterprise Time toggle switches the time zone the transactions are shown in — the property's local time or your enterprise's time.