Prerequisites
Permissions to View the alerts work page required.
Overview
The analytics tab on the alerts work page is designed to provide users with a clear visual representation of the transactions related to the alert. The analytics tab also displays any activity that occurred before or after the alert period allowing users to see the overall pattern of play for the player. The information and visual analytics displayed on the analytics tab varies depending on the type of alert. For most alert types, a graph will be provided that shows you information about the transactions that occurred within your chosen time period. You can use the date range selector or filter icon to adjust the data visual. On Active structuring, minimal play and WWC alerts, use the month arrows to move through the chart. Many alert types provide a transaction table below the data visual allowing you to click on an element of the data visual like a bar on a bar chart and see the associated transactions in the table below.
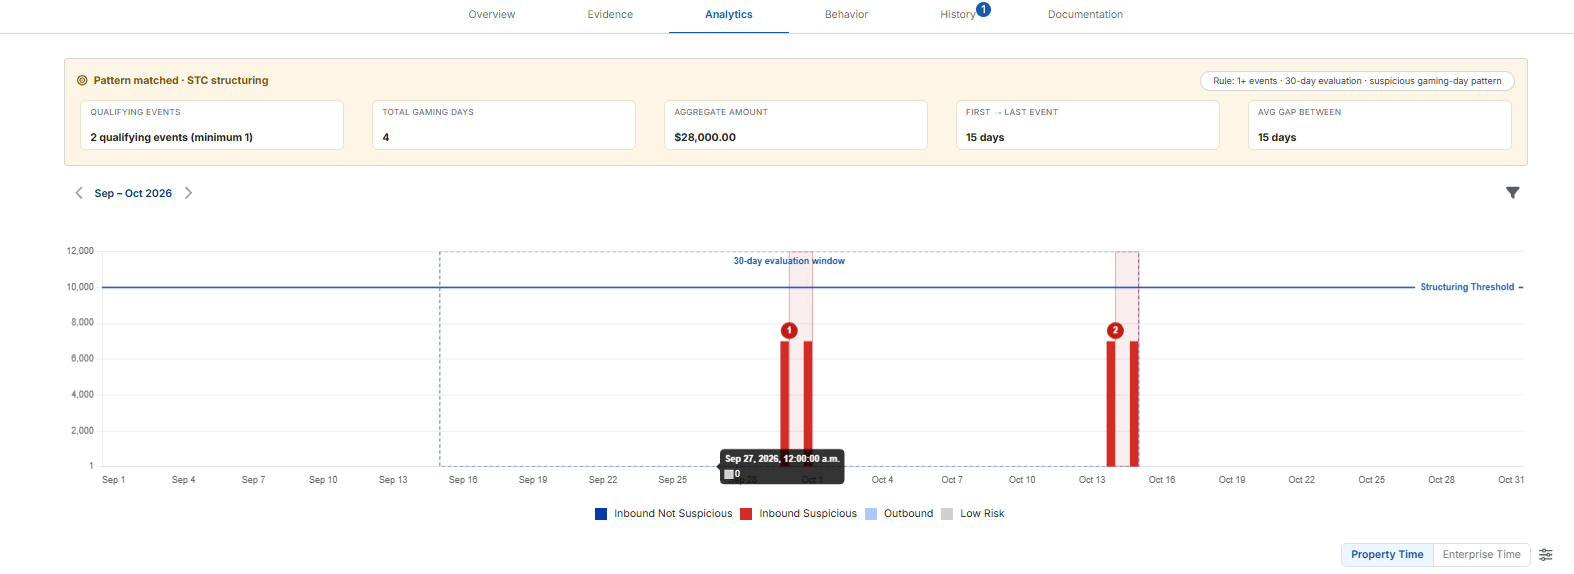
Data visuals follow two color patterns. Visuals displaying risk use blue for low risk and red for high risk. Visuals displaying general information use non-risk colors like purple, pink, and other colors to display general information like incoming and outgoing funds or time played.
Pattern matched view
If pattern qualification is configured for your property, the analytics on an Active alert open with a Pattern matched header and a pill showing the rule that was met. Summary cards show the number of qualifying events (for example 3 of 3), total gaming days, the aggregate amount and the first and last event dates. Each qualifying event is numbered on the chart. Without pattern qualification, the standard chart is shown.
The summary cards show:
Qualifying Events – How many qualifying events were found, compared with how many your settings require. For example, 3 of 3 means three events were found and three are required.
Total Gaming Days – The total number of suspicious gaming days across all qualifying events. Shown for alert types whose events are made up of gaming days.
Aggregate Amount – The total amount of the suspicious activity across all qualifying events.
First → Last Event – The number of days from the start of the first qualifying event to the end of the last one.
Avg Gap Between – The average number of days between the end of one qualifying event and the start of the next. It appears only when there are two or more events.