Prerequisites
Permissions to View Alerts Trend in the Alerts Work Page
Overview
The Alert Trends feature provides a visual dashboard of alert activity across a property or enterprise to help teams monitor patterns and optimize compliance efforts. It includes four diagrams and one table, all filtered by property and by the Start and End month in the top-right corner of the page. Alert Trends include both Active and Legacy alerts.
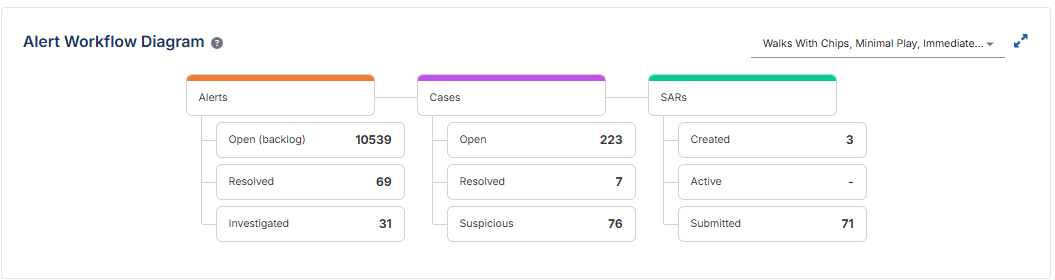
The Alert Workflow Diagram (top-left) shows how many alerts resulted in cases and SARs. This helps you understand the conversion rate of alerts into more serious compliance actions and can be filtered by alert type to analyze specific patterns.
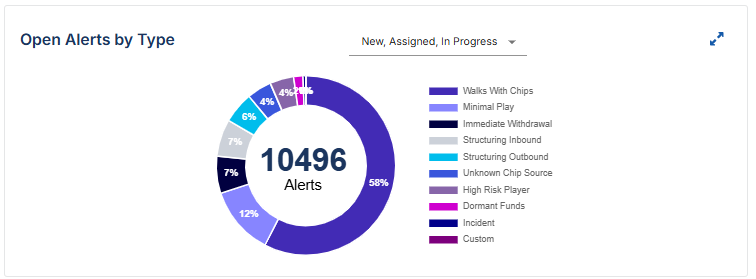
The Open Alerts by Type diagram (top-right) shows open alerts broken down by alert type. Use the status filter to choose which open alerts to include: New, Assigned and In Progress. This breakdown helps you identify workload distribution and where additional resources may be needed.
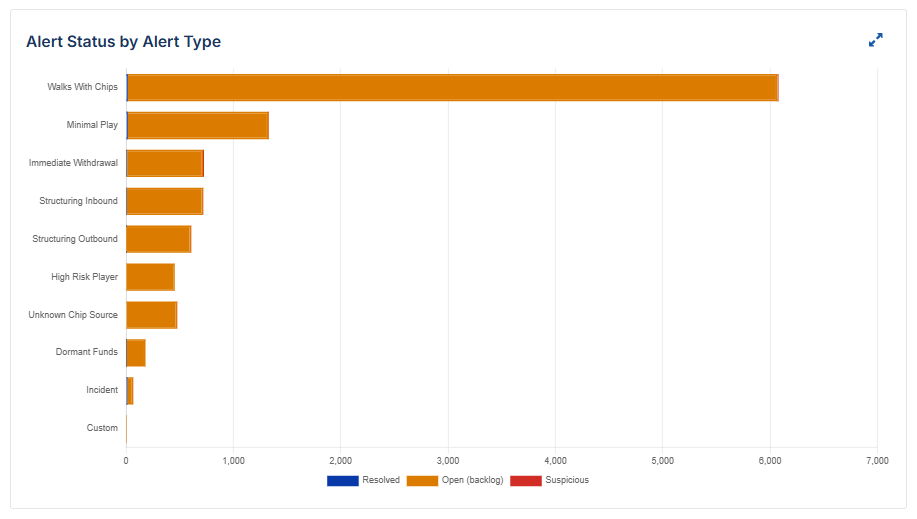
The Alert Status by Alert Type diagram (bottom-left) compares Resolved alerts (blue), alerts still Open (orange) and Suspicious alerts (red) for each alert type. Select an item in the legend to show or hide it. This visualization helps you evaluate the effectiveness of your alert settings and identify areas for optimization.
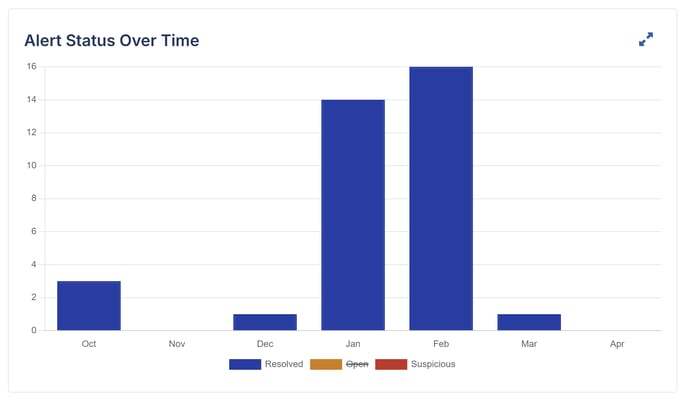
The Alert Status Over Time diagram (bottom-right) tracks Resolved, Open and Suspicious alerts month to month. This trend view supports workforce planning by helping you anticipate high- and low-volume periods.
The Alert Workflow Breakdown by Type table at the bottom shows, for each alert type, the open, resolved and suspicious alerts, the open, resolved and suspicious cases, and the created, active and submitted filings. It provides a quick reference for how many alerts are progressing through the pipeline and helps with resource allocation and performance tracking.
