Prerequisites
Permissions to View the alerts work page required.
Overview
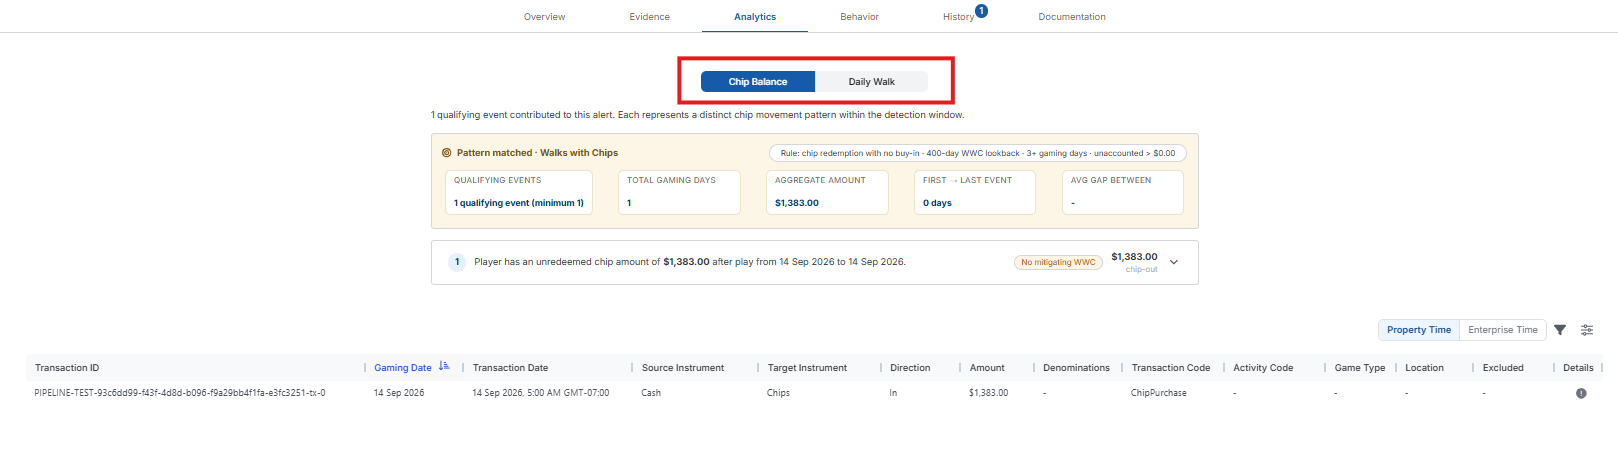
The WWC Analytics tab provides a visual summary of chip movement during the alert window to help assess player activity. Use the Chip Balance | Daily Walk toggle at the top of the tab to switch between the two views. A transaction table at the bottom of the page lists the transactions behind what you are viewing.
Chip Balance View
The Chip Balance view shows how many chips came into and went out of the casino for the player. Click the drop-down arrow on the right side of an event’s row to expand it and see that event’s chip balance details.

You’ll see two large columns: Chip-In to Casino, which represents all chips brought into the casino by the player, and Chip-Out to Player, which shows all chips returned to the player. Below each column is a card displaying the total amount. Clicking these cards reveals the individual transactions that make up each total in the transaction table at the bottom of the page.
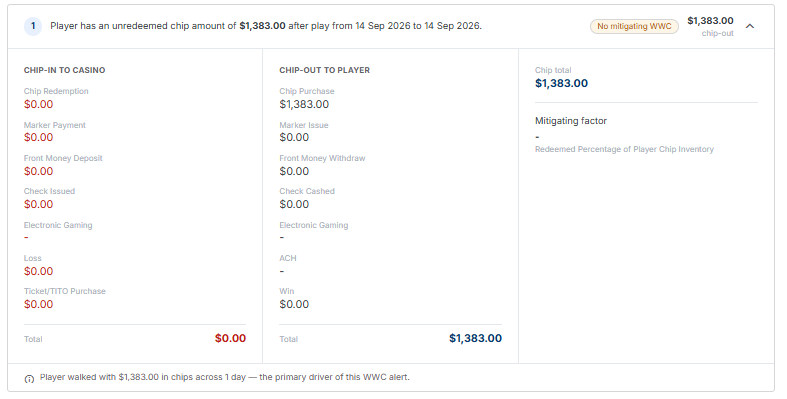
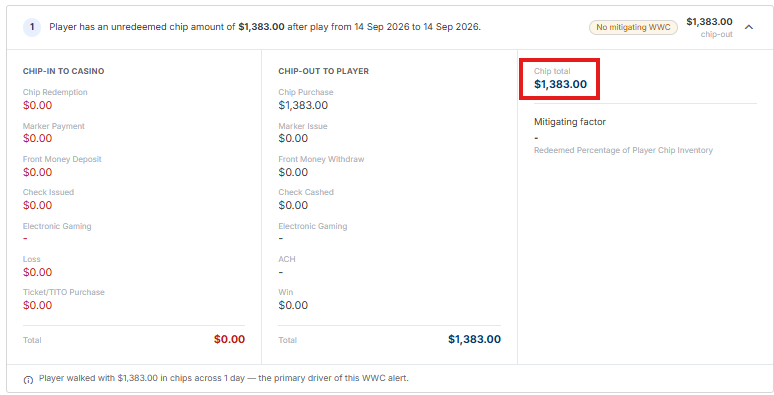
To the right of these columns is a card labeled Chip Total, which displays the amount of chips the player walked with during the alert window. Clicking the Chip Total card shows all transactions that contribute to this total.
With Pattern Qualification
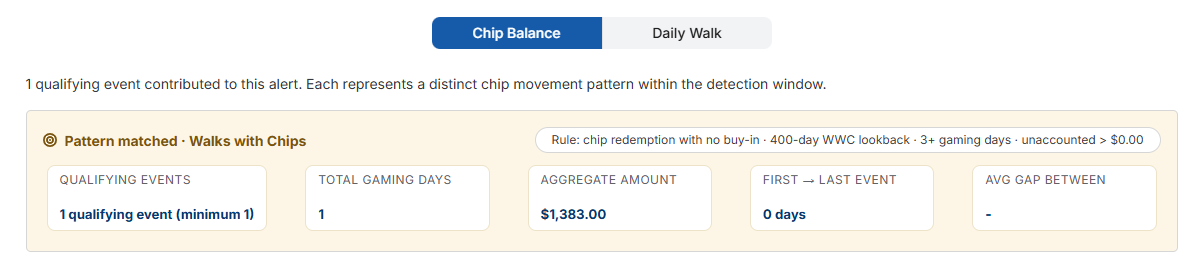
If pattern qualification is configured for your property, the Chip Balance view opens with a summary line, such as "1 qualifying event contributed to this alert," and a Pattern matched · Walks with Chips banner. The banner shows the rule that was met and the summary cards (Qualifying Events, Total Gaming Days, Aggregate Amount, First → Last Event and Avg Gap Between), which are explained in the article: What is the Analytics tab on the Alerts Work Page.
Below the banner, each qualifying event has its own numbered row. The row states the player's unredeemed chip amount and the dates of play, shows whether a mitigating factor applied (for example No mitigating WWC), and shows the chip-out amount. Select the arrow on a row to expand it. The expanded row shows the same Chip-In to Casino and Chip-Out to Player breakdown as the standard layout, for that event only, including the Ticket/TITO Purchase line and a total for each column. To the right are the event's Chip total and any Mitigating factor that applied, such as the redeemed percentage of the player's chip inventory. A line at the bottom summarizes the event, for example "Player walked with $1,383.00 in chips across 1 day — the primary driver of this WWC alert."
Daily Walk View
The Daily Walk view charts the player's chip balance day by day. Each bar is that day's chip balance: chip-out minus chip-in. A negative value appears only when inbound chips exceeded outbound chips. Each day on the chart is labelled with its Out and In amounts.
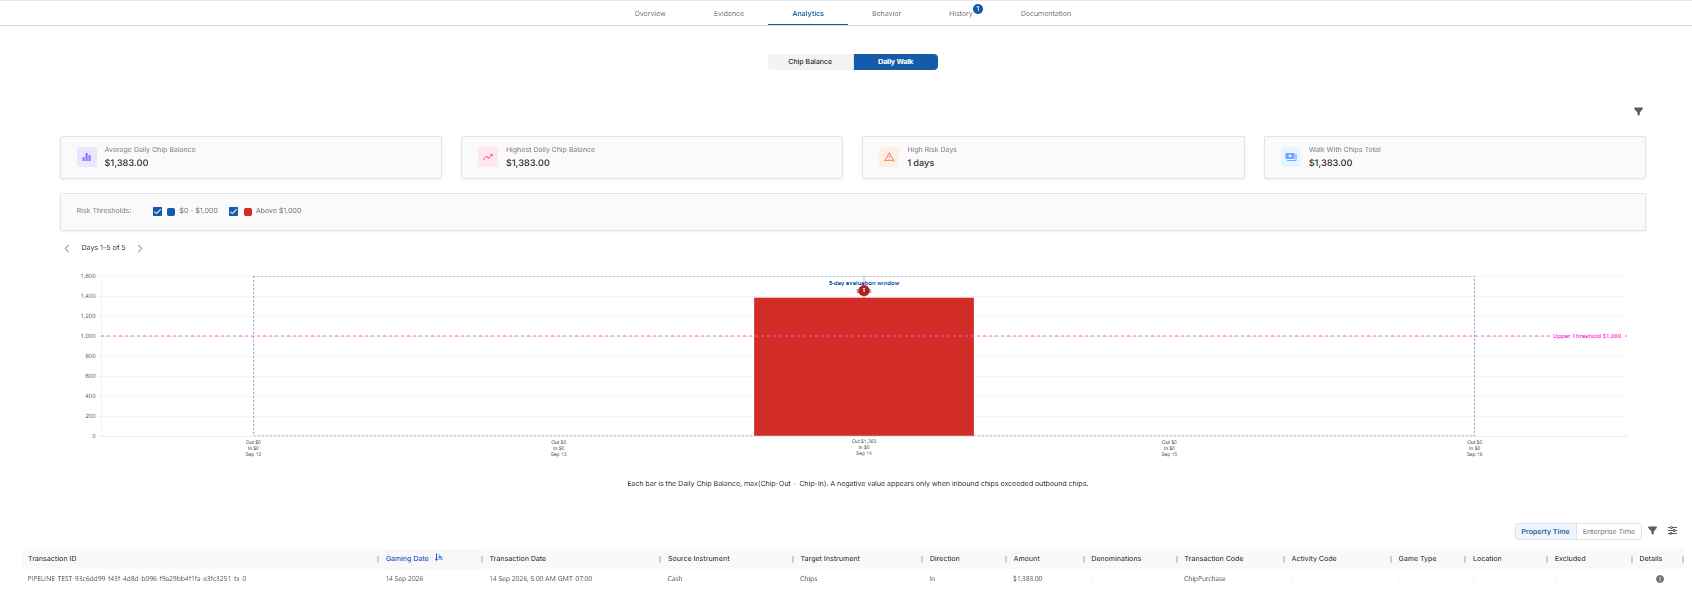
Cards above the chart summarize the days shown:

Average Daily Chip Balance – The average chip balance across the days with activity.
Highest Daily Chip Balance – The largest chip balance on a single day.
High Risk Days – The number of days whose chip balance reached the high-risk level shown on the chart: the Daily Walk Threshold if one is set, otherwise the upper threshold.
Walk With Chips Total – The total amount of chips the player walked with during the alert window.
Use the Risk Thresholds checkboxes to show or hide bars in each risk range. The dashed Upper Threshold line marks the Daily Walk threshold set in your alert settings. Use the arrows above the chart to page through the days, and select a bar to filter the transaction table to that day. The filter icon lets you switch the chart between Gaming Date and Transaction Date.
If pattern qualification is configured, the chart also outlines the evaluation window and numbers each qualifying event.