Prerequisites
Permissions to View the alerts work page required.
Overview
The Structuring Analytics tab provides a visual breakdown of daily cash transactions to help identify potential structuring behavior. Each bar is one gaming day's total. The chart distinguishes between Structuring Inbound (inbound cash transactions) and Structuring Outbound (outbound cash transactions) alerts.
Note: The Structuring Outbound chart does not include jackpot cash payouts, so the chart total matches the alert amount.
What the Bar Colors Mean
The legend under the chart shows four kinds of bars:
Inbound Not Suspicious (dark blue) – A day whose total was above the structuring threshold. A day over the threshold is reported as usual, so it does not suggest structuring.
Inbound Suspicious (red) – A day whose total stayed below the structuring threshold but within the suspicious range set in your alert settings. These are the days that suggest structuring.
Outbound (light blue) – Cash moving in the opposite direction, such as outbound transactions on an inbound alert, shown for context.
Low Risk (gray) – A day whose total was below the low-risk amount in your alert settings. These days are hidden by default; use the filter to show them.
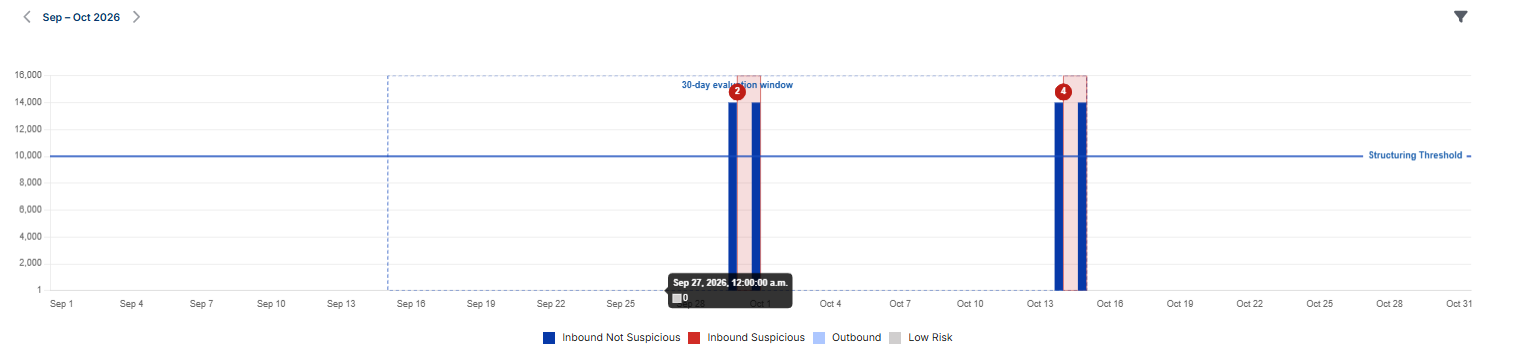
For example, with a structuring threshold of $10,000, a day with $14,000 in cash-in appears as a dark blue Inbound Not Suspicious bar because it is above the threshold. A day with $9,500 in cash-in, inside the suspicious range, appears as a red Inbound Suspicious bar.
The solid Structuring Threshold line marks the threshold amount.
Click a bar to filter the transaction table below to that day's transactions in the bar's direction (inbound or outbound).
Pattern Matched View
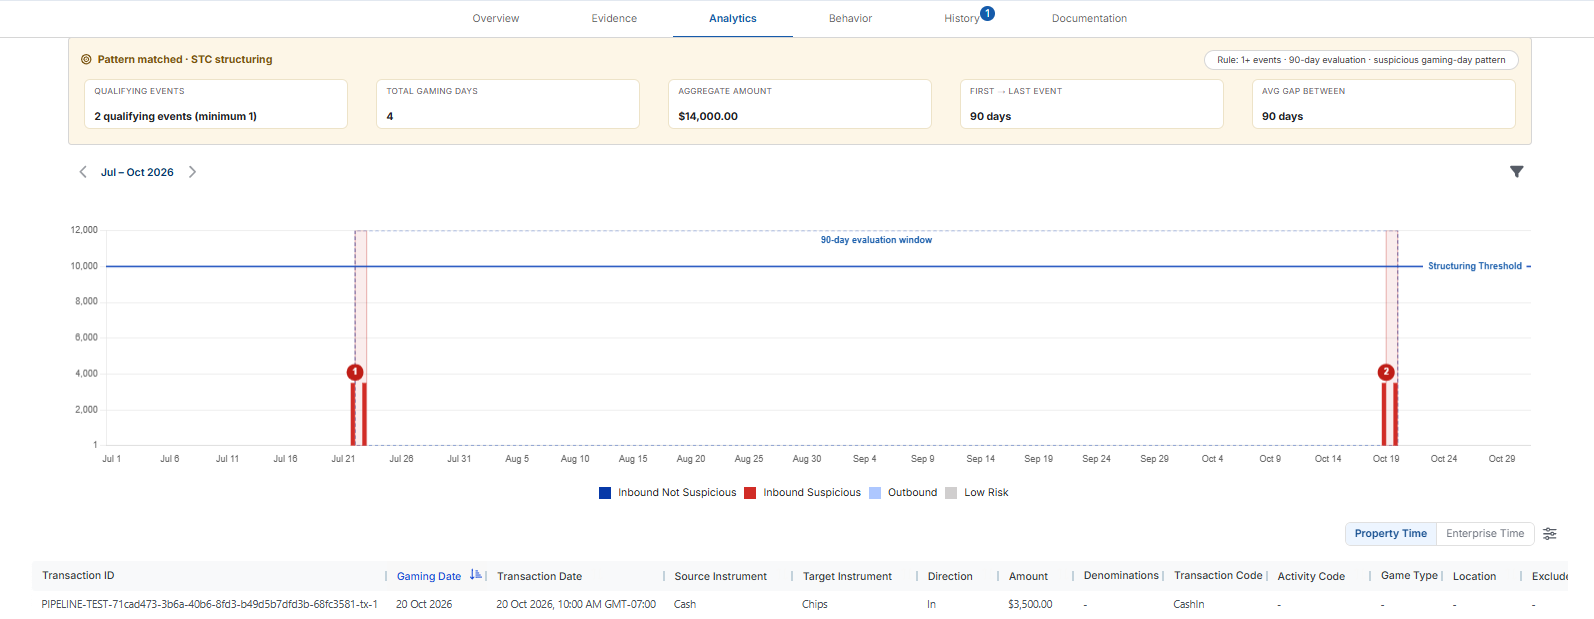
If pattern qualification is configured for your property, the tab opens with a Pattern matched · STC structuring banner. The pill on the right shows the rule that was met, for example 1+ events · 90-day evaluation · suspicious gaming-day pattern. The banner's summary cards show:

Qualifying Events – How many qualifying events were found, compared with how many your settings require. For example, 2 qualifying events (minimum 1).
Total Gaming Days – The total number of suspicious gaming days across all qualifying events.
Aggregate Amount – The total amount of the suspicious activity across all qualifying events.
First → Last Event – The number of days from the start of the first qualifying event to the end of the last one.
Avg Gap Between – The average number of days between the end of one qualifying event and the start of the next. It appears only when there are two or more events.
On the chart, a dashed box labelled with the evaluation period, for example 90-day evaluation window, marks the period Kinectify checked for qualifying events. Its length matches the evaluation period in your alert settings. Each qualifying event is shaded and numbered (1, 2 and so on), so you can see when each one happened.
Moving through the Chart and Filtering
Use the arrows above the chart to move between months. The page that contains the evaluation window spans every month it covers, for example Jul – Oct 2026; other months show one at a time.
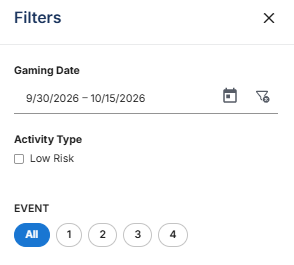
Use the filter icon in the top-right corner to open Filters:
Gaming Date – Enter a start and end date to narrow the chart to that range.
Activity Type → Low Risk – Check it to show only the low-risk days; uncheck it to return to the regular view.
Event – If pattern qualification is configured, select an event number to show only that qualifying event on the chart, or All to show every event.
Select Reset to clear the filters, or Done to close the panel.