Prerequisites
Permissions to View the alerts work page required.
Overview
The Minimal Play Analytics tab provides visual insights into player activity and fund utilization during the alert window. If pattern qualification is configured, the chart also covers the full evaluation period. The transaction table below the chart lists the transactions included in the alert. Click a bar on either chart to filter the table to that gaming day.
Use the Amount | Utilization % toggle at the top of the tab to switch between two charts:
The Amount chart shows the daily totals of inbound funds, outbound funds and wagers, along with game time played.
The Utilization % chart shows each day's utilization: wagers as a percentage of inbound funds (solid bars) and of outbound funds (striped bars), compared with your utilization threshold.
Reading the Amount chart
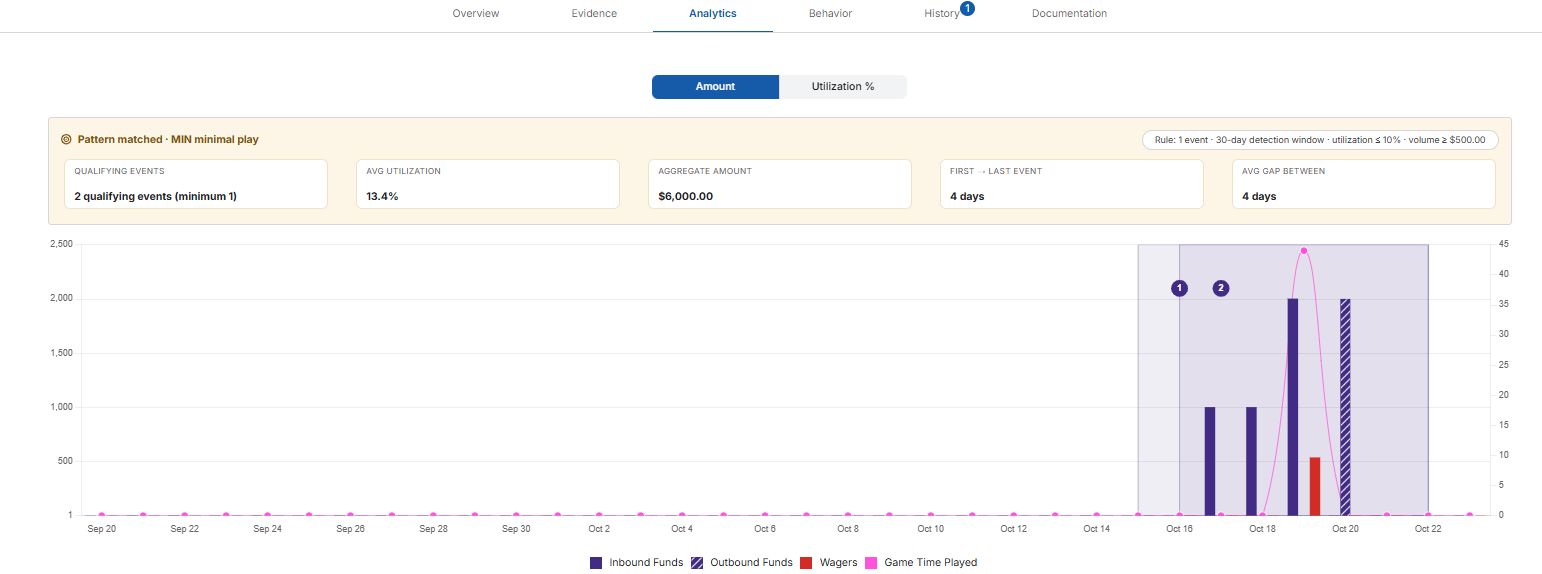
The scale on the left shows dollar amounts. The legend under the chart shows:
Inbound Funds (solid purple) – The total of the player's inbound transactions for the gaming day.
Outbound Funds (striped purple) – The total of the player's outbound transactions for the gaming day.
Wagers (red) – The total amount wagered that gaming day.
Game Time Played (pink line) – How long the player played that gaming day, read against the scale on the right.
Comparing the Wagers bar with the Inbound Funds bar shows how much of the money brought in was actually played. A small red bar next to a tall purple bar means little play.
Reading the Utilization % chart

The solid Utilization Threshold line marks the utilization threshold in your detection and escalation settings. The legend under the chart shows four kinds of bars:
High Risk Inbound (red) – Wagers were below the utilization threshold as a percentage of inbound funds.
High Risk Outbound (striped red) – Wagers were below the utilization threshold as a percentage of outbound funds.
Not Suspicious Inbound (dark blue) – Inbound utilization was at or above the threshold.
Not Suspicious Outbound (striped dark blue) – Outbound utilization was at or above the threshold.
Pattern matched view
If pattern qualification is configured for your property, the Amount chart opens with a Pattern matched · MIN minimal play banner. The pill on the right shows the rule that was met, for example 2 events · 90-day detection window · utilization ≤ 49% · volume ≥ $5,000.
The banner's summary cards show:

Qualifying Events – How many qualifying events were found, compared with how many your settings require. For example, 2 qualifying events (minimum 1).
Avg Utilization – The average utilization percentage across the qualifying events.
Aggregate Amount – The total inbound funds across all qualifying events.
First → Last Event – The number of days from the start of the first qualifying event to the end of the last one.
Avg Gap Between – The average number of days between the end of one qualifying event and the start of the next. It appears only when there are two or more events.
On both charts, each qualifying event is shaded and numbered (1, 2 and so on). Hover over an event to see its Total Amount and Utilization %. The banner appears only on the Amount chart.
If the chart covers more than one month, use the arrows above the chart to move between months.